- Overview
- EcoDevo - Biol 4370
- Evolution - Biol 3306
- Scientific Communication - Biol 6312
- Biology & Biochemistry Undergraduate Research Training (BURT) Program & Course (BIOL/BCHS 3396 & 4396; AKA Senior Research Project)
- Major Interest Group (IDNS 2197)
- (Award Winning!) GalapaGo! Research-Based Learning Abroad Program & Preparatory Course
- The Evolution and Development of Polyphenisms
- STEM Careers Seminar: And you may ask yourself, how did I get here?
- Houston Zoo Paid Summer Internship

Scientific Communication - Biol 6312
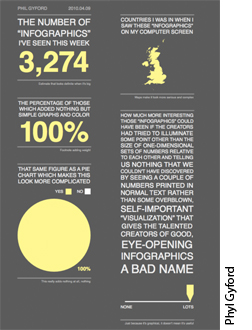
A large part of being a scientist involves the effective communication of data and ideas. In this course, we explore different means of relaying scientific information, focusing on the basics of effective data visualization, aesthetics of figure and poster design, writing various kinds of documents, and oral presentations. We also discuss how to tailor presentations for different audiences, such as specialist or popular publications.
The course format involves a substantial amount of figure construction, writing, critique and oral presentation. Students are encouraged to use the same idea, such as a portion of their research proposal, as the topic for their various presentations. At each step, we use substantial peer review and revision to hone our communication skills.
We also talk about how to navigate non-scientific aspects of your graduate career, from assembling a committee, to setting and communicating clear expectations, managing your advisor, giving a great committee meeting, through conflict management. Finally, we talk about systemic issues in society and in STEM that exclude or inhibit the success of people from particular populations, and we discuss individual barriers to success such as imposter complex and stereotype threat. Our goals here are to i) help make you aware of things that can inhibit your training, sense of belonging, and personal and professional growth, ii) help you develop skills and tools that will aid you in navigating these barriers so you can be more successful, and iii) show you how an understanding of these barriers can help you be a better instructor and advisor to your trainees.
To get a feel for current thought on data visualization, check these blogs: Datavisualization, Flowing Data, and my personal favorite, Information is Beautiful.